DSCI 550 Assignment 3 (Project Final Visualization)
Assignment 3 Project Report
- GitHub Repo: https://github.com/Anthonyive/DSCI-550-Assignment-3
- Demo: fradulent-emails-d3.ml
Visualization 1 - Email Content Word Cloud
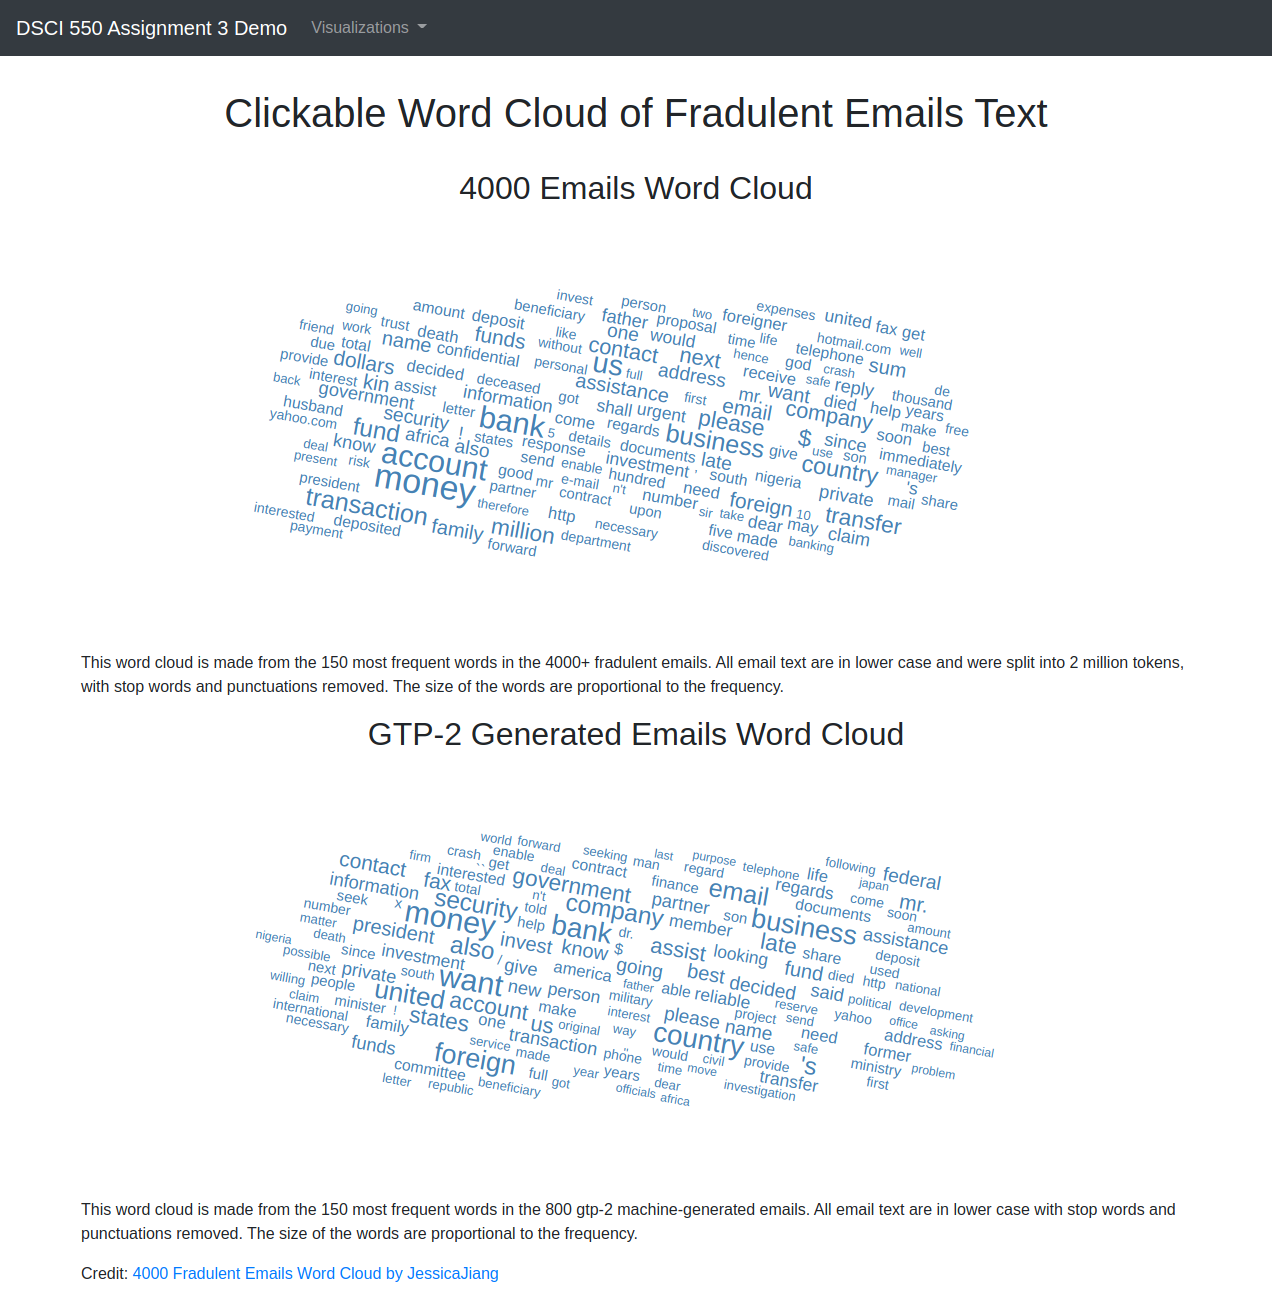
We decided to make clickable word cloud images for visualizing the emails’ text content from assignment 1 and 2. The intent is to compare the original 4000 email corpus with the machine generated email text and understand how attackers phrased. The top 150 words with the most frequency are displayed in the cloud proportional to their appearance in the emails, with punctuations and stop words removed. We can see that in a lot of words appeared often in both corpus, such as ‘ bank’, ‘money’, ‘fund’, and ‘business’. It is intuitive to understand that phishing emails mention words relating to money and fund a lot and this is closely connected to their attack types.
Visualization 2 - Attack type popularity and connectivity
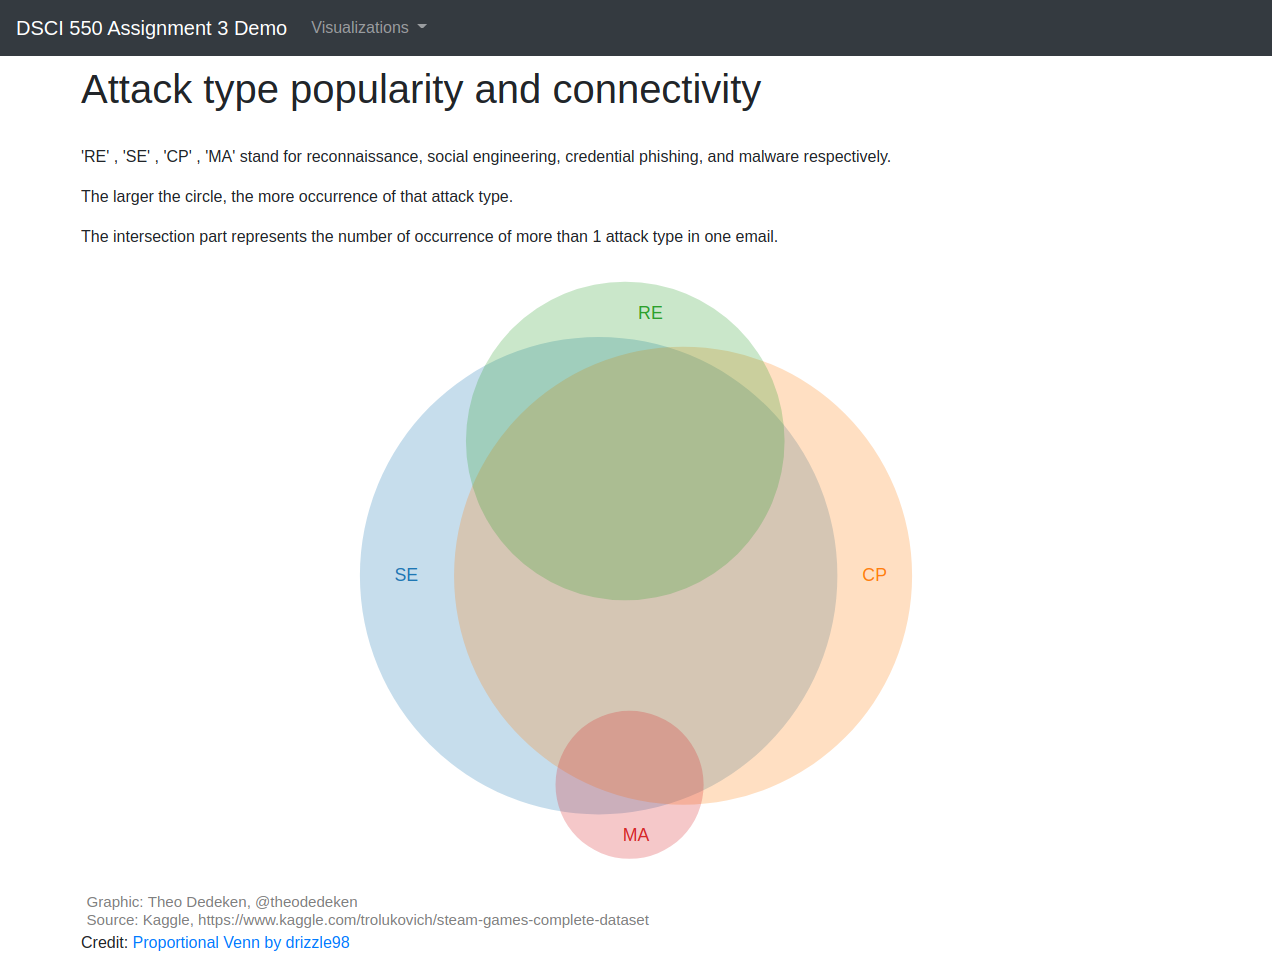
To the very beginning, we are required to seek the correlation among attack types and other fraudulent emails’ features. However, we believe that the inner relationships among these four attack types might be ignored. So we decided to see the popularity and connectivity of each attack type by using Venn Diagram. The “RE”,”SE”,”CP”,”MA” each stands for “Reconnaissance”, “Social Engineering”, “Credential Phishing”, “Malware”. And according to the graph, we can find that social engineering is very likely to appear together with credential phishing and malware is more likely to be an independent attract type.
Visualization 3 - Multi-Line Chart of Date & Stock
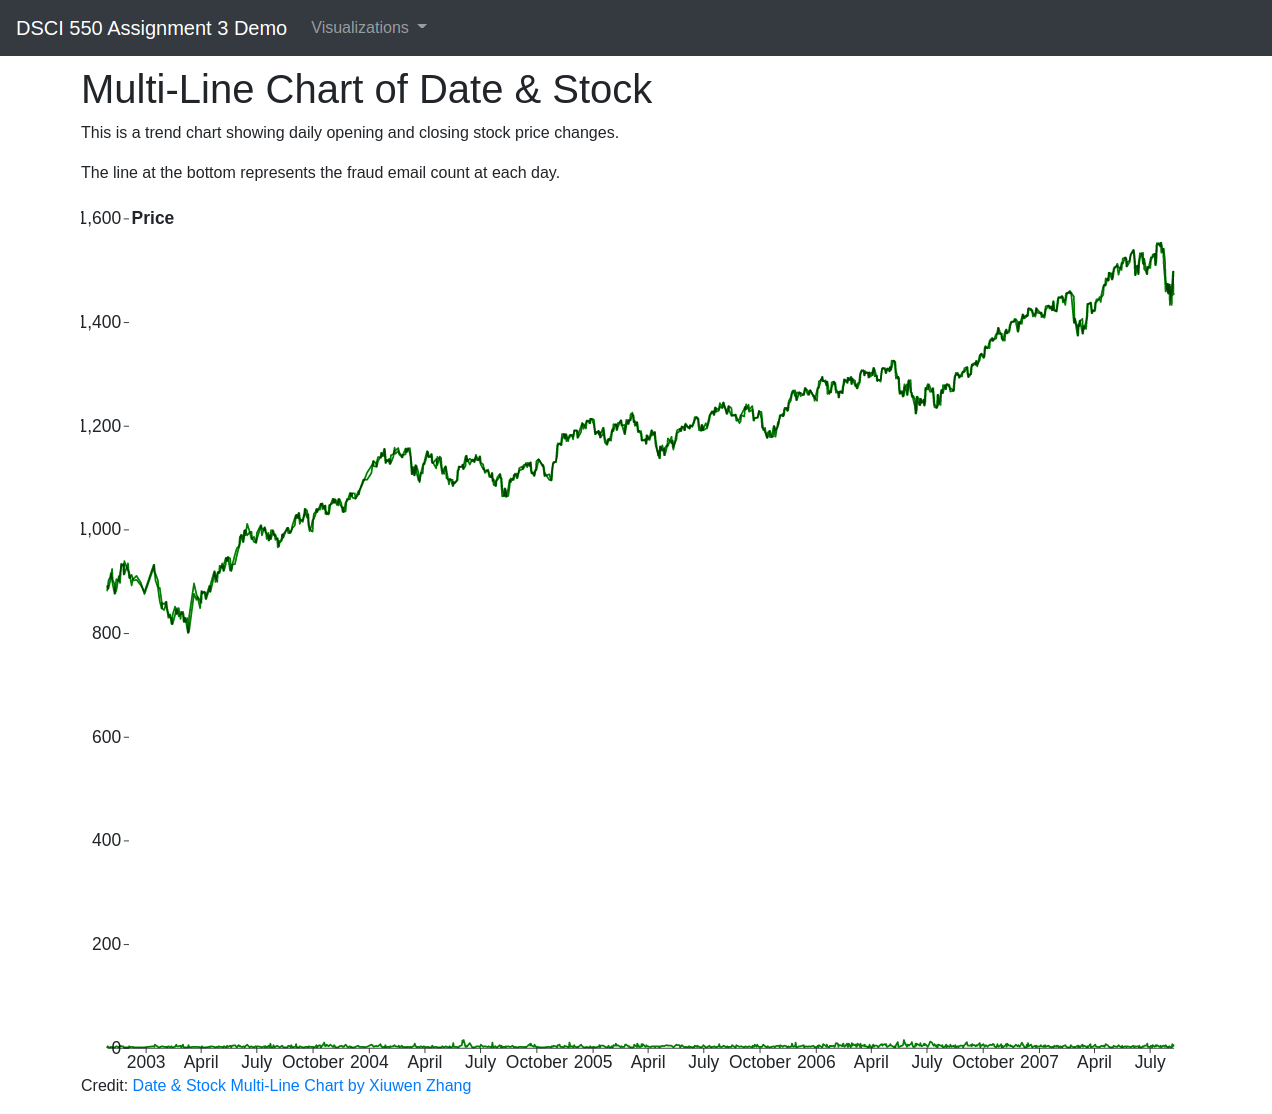
We would like to find out whether the number of fraud emails for each day from 2003 to 2007 is related to the daily opening and closing stock prices. We chose a line chart for this because the line chart can clearly show the trends of how data vary. There is only little difference between opening and closing prices, but it’s clear that the prices are continually increasing over time. From the line at the bottom (which can be hardly seen), we can see that the number of fraudulent emails doesn’t vary too much. Thus, the stock prices seem to have little influence on the fraud emails.
Visualization 4 - Calendar View of Fraudulent Emails
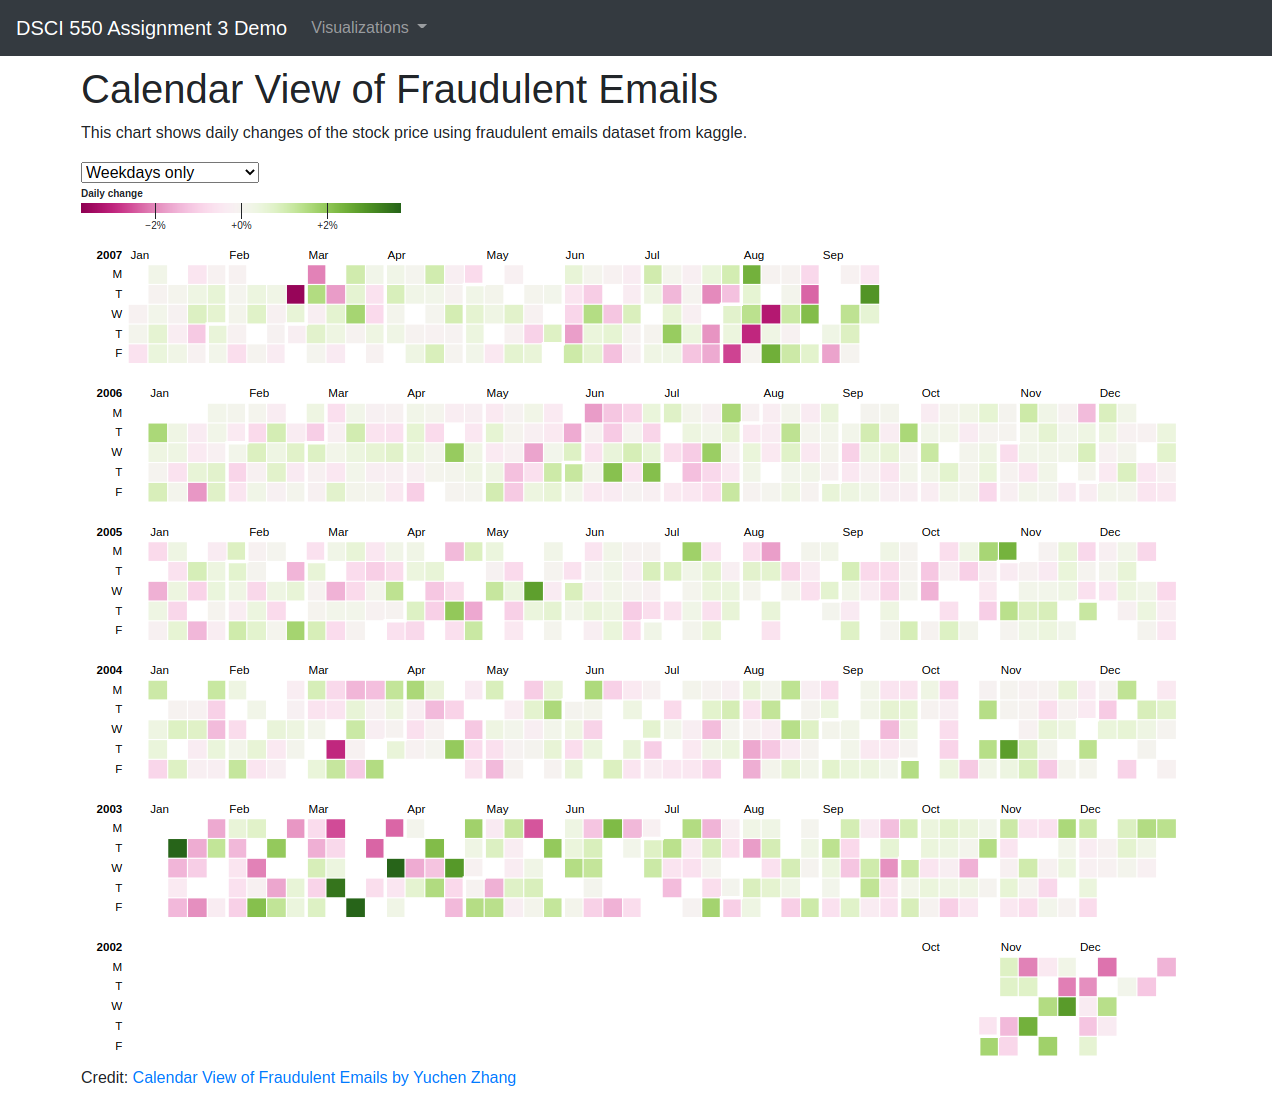
We wanted to find out how the stock market changed over the time period of these fraudulent emails. Besides the multi-line chart that shows the overall stock market price changes during 2003 to 2007, we also wanted to show how the daily opening and closing stock price related to the previous day. Calendar view plot is a great way to show off our intent. The greener the blocks are, the more daily changes it has. We also have some white blocks since we don’t have all the prices of these dates. However, sometimes we may have multiple stock prices on the same day, then we will take the average. We can see that the changes most happened around the winter/spring of 2003 and the summer of 2007.
Visualization 5 - Bubble Map of Fraudulent Emails Attacker Locations
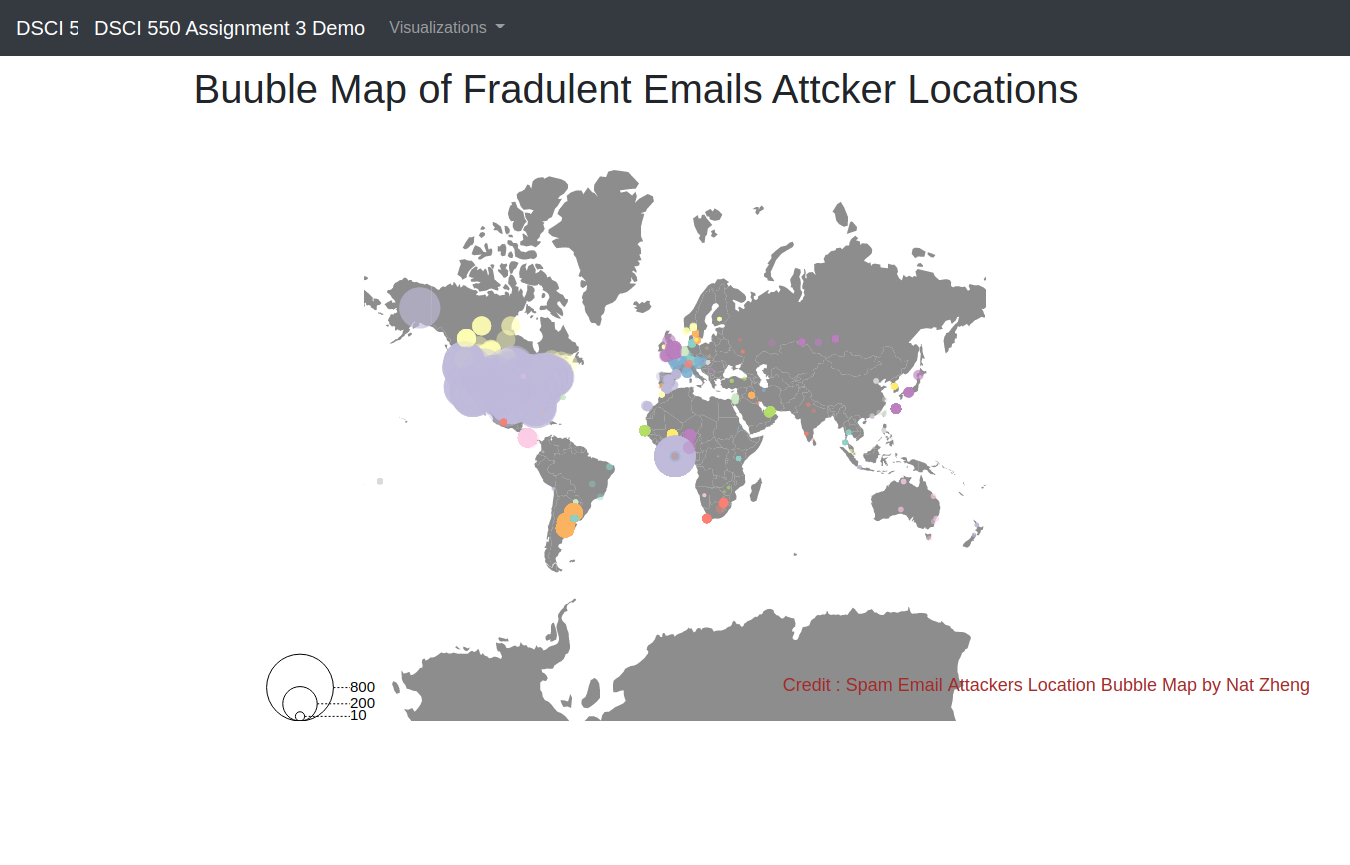
This is a bubble map for fraudulent email attackers’ location or the countries that they mentioned in the email contents. Size of the bubble indicates the number of spam emails sent from a certain location. The bubble map informed us that the majority of the attackers are located in North America. Some spam email attackers clustered in Africa and South America. Only a few attackers highlighted Asian countries in their emails or sent out emails from Asian countries. We would not be able to easily conclude where the majority of the spam emails came from just by extracting ip address or mentioned locations from email. Generating graphs are visually more straight-forward and convincible.
Contributions
|
Yuchen Zhang
|
Xiuwen Zhang
|
|
Nat Zheng
|
Zixi Jiang
|
|
Peizhen Li
|
Xiaoyu Wang
|